
There are multiple ways to explore and access Copernicus Marine data and services.
The available tools are designed for different levels of expertise – from simple map viewers for beginners to advanced platforms for data analysis and processing.
Progress step by step, from quick visual insights to in-depth analysis, unlocking the full potential of the Copernicus Marine Service.
Below you will find the main entry points to the Copernicus Marine platform, organized by difficulty level – from beginner-friendly viewers to advanced data access and processing environments.
Be curious and have fun!
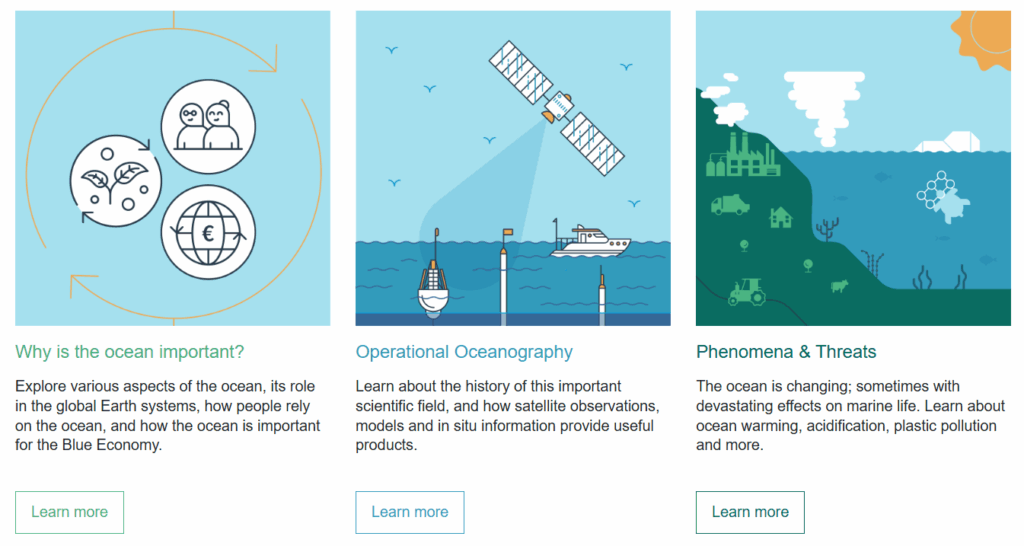
Ocean explainers
Start with the Ocean Explainers to learn about the ocean in a simple and fun way with the ocean explainers prepared by Copernicus Marine. Understand the interactions in the ecosystem, historical changes and ocean phenomena in a simple and interactive way.
Beginner
Check out marine data visually with MyOceanLearn from Copernicus Marine
Link to the site: https://myoceanlearn.marine.copernicus.eu/
Intermediate
Start interacting with the data and check the main datasets.
Link to the site: https://data.marine.copernicus.eu/viewer
Advanced
Full access to the data in the pro viewer of Copernicus Marine, with additional monitoring tools and projections.
Link to the site: https://data.marine.copernicus.eu/viewer/expert
Expert
Use Github and Jupyter Notebooks to interact with the data, download it and manipulate it.
Check out this example on how to access the data. Run it directly in Google Colab, simply run the individual cells by pressing the play buttons in sequence.
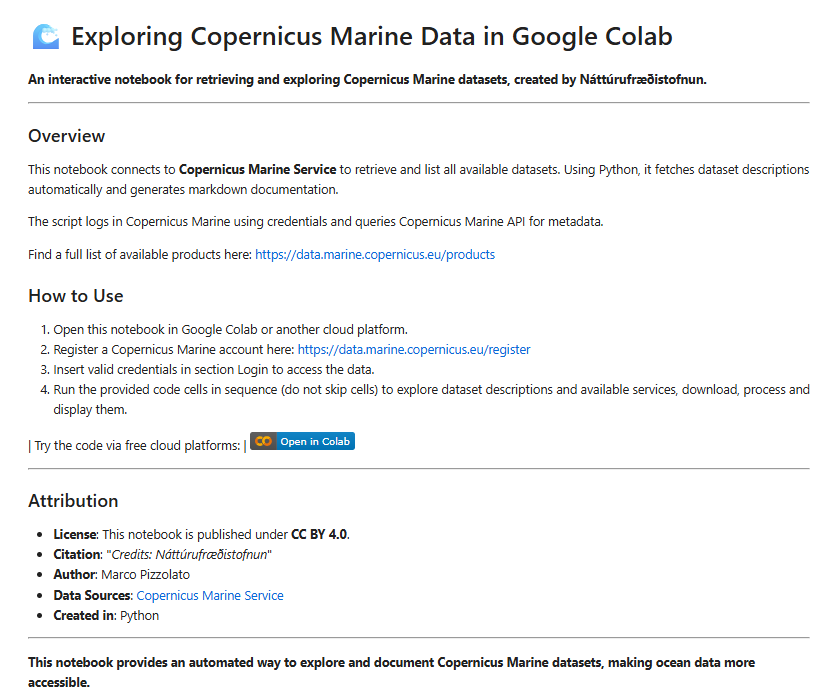
You need a Copernicus Marine Account for it. Register here :
Find more Copernicus data Notebooks in our GitHub
Try more Jupyter Notebook examples from Copernicus Marine here:
Join Online Workshops
Join others in Online workshops and events to ask your questions directly to professionals and get in contact with a community of experts.
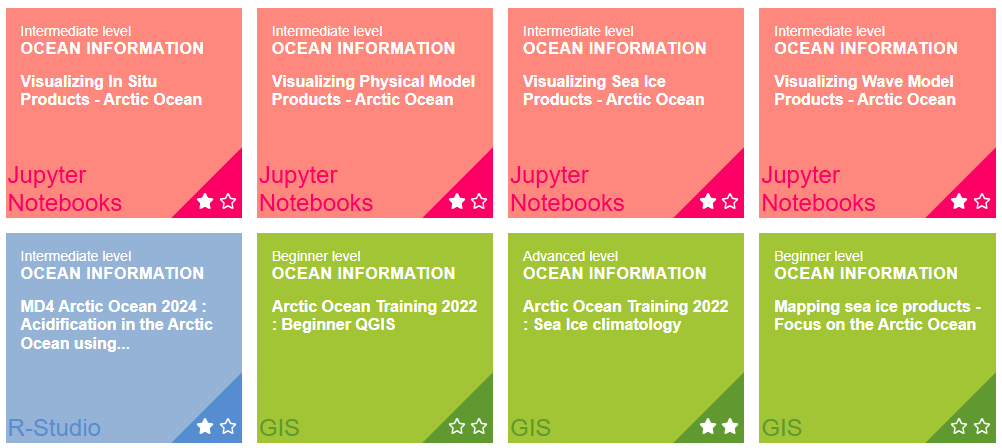
Access E-Learning Material
Find e-learning material on how to use Copernicus Marine data and services in a wide variety of applications f. ex. Jupyter Notebooks, R-Studio, QGIS, …
Mix in additional data
Explore additional datasets for example the european EMODnet data about vessel traffic, fishing grounds, bathymetry, and more.
Find more data here:
Here an example of fishing vessel density between 2019 and 2025.
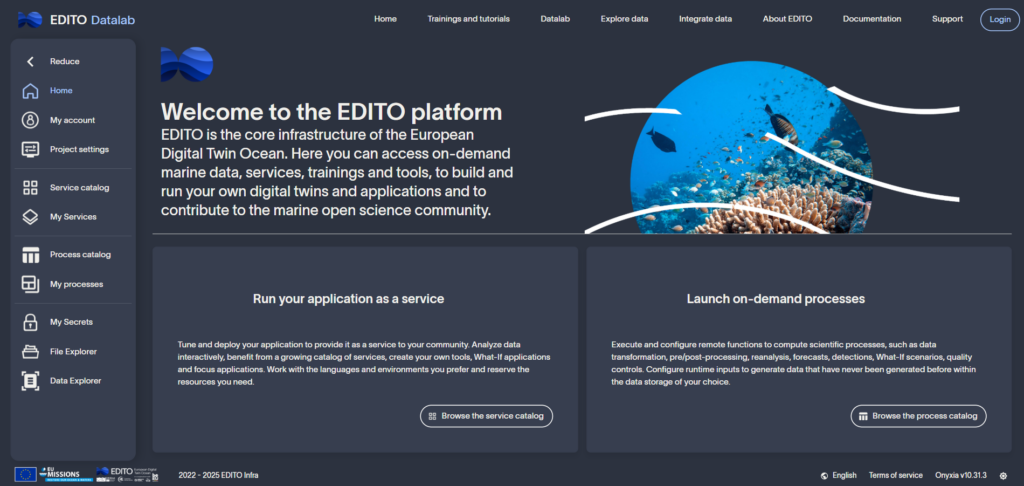
Digital Twin
Build your own tools with an ocean of data at your finger tips with the European Digital Twin Ocean (EDITO), containing a multitude of datasets ready to use.